Open sidebar

SCHOLARSHIPS FOR HISPANIC AND LATINO STUDENTS

Standard

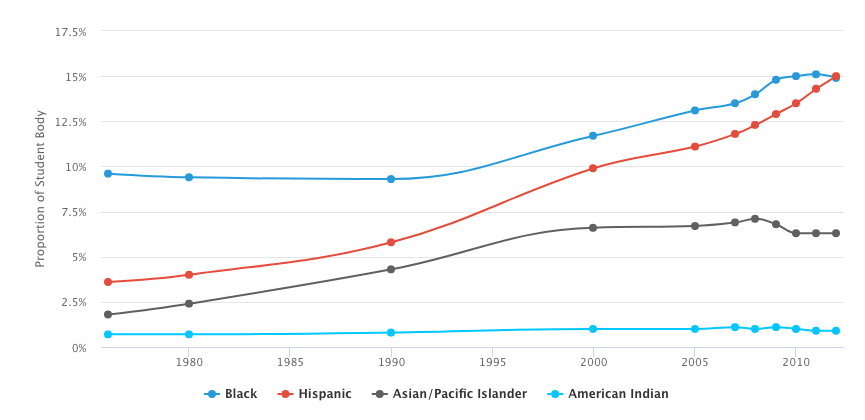
College enrollment rates are rising among Hispanic men and women in the United States. Recent data from the Pew Research Center shows that 2.2 million Hispanics between the ages of 18 and 24 were enrolled in a two-year or four-year degree program in 2015; this figure represents a threefold increase since 1993. This rise in postsecondary attendance is largely attributable to the nation’s growing Hispanic population and a sharp decline in the high school dropout rate among this demographic. According to the National Center of Education Statistics (NCES), the percentage of college students who identify as Hispanic rose from 4% to 15% between 1976 and 2012. Hispanic students reached a new milestone in 2012 when, for the first time, Hispanic high school graduates enrolled in college at a higher rate than their Caucasian counterparts. The U.S. Census Bureau estimates one in four college students will identify as Hispanic by 2020.

MINORITY STUDENT ENROLLMENT 1976-2012

MINORITY STUDENT ENROLLMENT 1976-2012

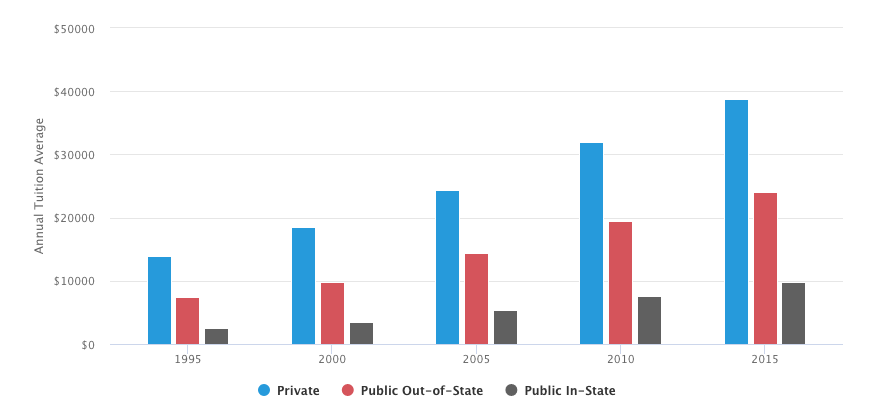
Persistent educational challenges continue to affect the Hispanic community, however. Many college-bound Hispanic men and women come from low-income families, and tuition rates for in-state students at public universities have risen 296% over the past 20 years. Consequently, many of these students are forced to absorb student loans to afford their degree. These loans carry steep monthly minimum payments and interest rates that can affect borrowers for decades.

TUITION GROWTH AT NATIONAL UNIVERSITIES

TUITION GROWTH AT NATIONAL UNIVERSITIES

Pew Research data shows that 22% of Hispanic students have outstanding student debt. While this is the lowest rate of debt among student racial groups, it should be noted that nearly half of all Hispanic students complete their education at a two-year community or technical college. These programs tend to be significantly less expensive than four-year programs, but they are also less likely to help students secure meaningful post-college employment. As of 2015, only 15% of Hispanics aged 25 to 29 held a bachelor’s degree in any subject.

FAMILY NEEDS

Family obligations present another challenge to Hispanic learners. A 2015 survey by the National Journal found that two-thirds of Hispanic men and women who sought full-time work or joined the military after high school claimed to have done so in order to financially support their loved ones. By comparison, only 39% of white men and women who bypassed college made the same claim.

FIRST-GENERATION COLLEGE STUDENTS

First-generation Hispanic college students face additional obstacles. The percentage of first-generation students at all U.S. postsecondary four-year institutions fell from 38.5% to below 16% between 1971 and 2005, according to a report from UCLA. A study by the National Conference of State Legislatures (NCSL) further estimates that up to half of Latino parents have not received any postsecondary education. Many educational experts agree that parents without a college background are unable to fully prepare their children for the rigorous academics and the social pressures of institutionalized higher education. “Without family background in the college experience,” the study notes, “these students may find it difficult to fully engage in college life, which can lead them to drop out and not complete a degree.”

ENGLISH AS A SECOND LANGUAGE

Language barriers are another factor. Hispanics made up 46% of all U.S. immigrants in 2013, according to data from the Migration Policy Institute, and the National Education Association (NEA) notes that roughly 80% of the country’s English Language Learners (ELLs) identify as Hispanic. Despite a widespread emphasis on English instruction in U.S. public schools, however, less than 20% of k-12 ELL students earn average or above-average reading comprehension scores. Furthermore, up to 10% of ELL students between the ages of 12 and 18 are forced to repeat a grade every year. The lack of English speakers in the home is a major reason for these trends.

CHILDREN OF MIGRANT WORKERS

Another underrepresented group are the children of Hispanic migrant workers. Each year, the U.S. Department of Education’s Migrant Education Program serves approximately 345,000 Hispanic students between the ages of three and 21. The College Assistance Migrant Program (CAMP) offers financial support for college freshmen, along with five-year tuition grants, but because migrant families are constantly on the move, these students often perform poorly in the classroom and their secondary school dropout rates are higher than non-migrant students.

hispanic_scholarship_guide-copy

Roughly 65,000 undocumented students graduate from U.S. high schools each year. The U.S. Department of Education guarantees public education for undocumented children through grade 12. Additionally, there are no federal or state laws prohibiting undocumented men and women from applyng to, enrolling in, and graduating from public or private colleges. A survey by the National Association of Student Financial Aid Administrators (NASFAA) found that 32% of public postsecondary institutions admitted undocumented student applicants.

However, many schools categorize undocumented students as “foreign”, thus making them ineligible for both federal financial aid and in-state reduced tuition rates. The Obama administration has introduced a bill known as the Development, Relief, and Education for Alien Minors (DREAM) Act that would create a college pathway for undocumented students by providing them with permanent residency. However, the DREAM Act has yet to receive congressional approval as of April, 2016.

DEFERRED ACTION FOR CHILDHOOD ARRIVALS

Students in the U.S. must be permanent residents before they can receive federal financial aid. Most immigrants earn permanent residency by applying for a Green Card, but current laws stipulate that undocumented citizens are unable to take this path; they must instead leave the United States and apply for permanent residency from a consulate office in their home country.

The Deferred Action for Childhood Arrivals program, or DACA, seeks to ease college admission challenges for undocumented students. Under DACA, undocumented children who enter the U.S. prior to age 16 receive “deferred action status” and are categorized as DACA Students. They may also be able to obtain a social security number (SSN). While DACA students are still ineligible for federal financial aid, those with a valid SSN are able to fill out a Free Application for Federal Student Aid (FAFSA) and they may receive state- or institution-sponsored funding.

DACA students may also qualify for reduced in-state tuition, although discounted rates are often available. A total of 18 U.S. states currently offer provisions for undocumented students to receive discounted in-state tuition. These include: California, Colorado, Connecticut, Florida, Hawaii, Illinois, Kansas, Maryland, Michigan, Minnesota, Nebraska, New Mexico, New York, Oklahoma, Oregon, Rhode Island, Texas, Utah, and Washington. In contrast, three states have barred reduced in-state tuition for undocumented students: Arizona, Georgia, and Indiana. The remaining 29 states are classified as unstipulated.

Undocumented students should meet with their high school career counselor to discuss financial aid options for college. Most DACA students with a valid SSN are urged to complete a FAFSA in order to learn about state- and institution-based financial aid options. The Department of Education offers the following tips for DACA students who wish to fill out a FAFSA:

HOW TO FILL OUT THE FAFSA AS AN UNDOCUMENTED STUDENT

  • The FAFSA does account for the citizenship status of the applicant’s parents, but the form requests the SSNs of both parents. Applicants must write in 000-00-0000 for the SSN for any undocumented parent or legal guardian.

  • Applicants will encounter the following question: “Are you a U.S. citizen?” Undocumented students must check the box for “No, I am not a citizen or eligible noncitizen.”

  • There are also questions inquiring about the “legal state of residence” for the applicant and their parents. The correct answer will vary, as each U.S. state has different requirements for legal state residency. Applicants should consult their on-campus career counselor before completing this section.

  • The online FAFSA form features an IRS Data Retrieval tool that allows applicants to submit their tax information and their parents’ tax information. If the applicant or their parents did not file an income tax return during the previous year, then tax information may be entered manually.

HISPANIC-SERVING INSTITUTIONS

The Hispanic-Serving Institutions (HSI) program was enacted through Title V of the Higher Education Act. HSI status is conferred on not-for-profit postsecondary institutions where at least 25% of full-time students identify as Hispanic. Under Title V, eligible HSIs can receive grants from the U.S. Department of Education’s Office of Postsecondary Education (OPE). Grant funding is then used to build on-campus resources and bolster support services for Hispanic students. Today, HSIs are represented by the Hispanic Association of Colleges & Universities (HACU); although HACU members comprise only 10% of U.S. postsecondary institutions, these colleges and universities are home to more than two-thirds of the nation’s Hispanic student population.

The rising number of HSIs in the U.S. directly correlates with the increasing number of Hispanic students enrolling in accredited college programs. There were 245 recognized HSIs in 2005, and as of 2014-15, there were 435 recognized HSIs that collectively enrolled more than 1.8 million students. The states with the most HSIs are California with 152, Texas with 78, Florida with 24, and New Mexico with 23. Additionally, Puerto Rico has 63 recognized HSIs.

latin_scholarships_guide-copyscholarship is a monetary gift for students to use for funding their postsecondary education. Scholarships do not need to be paid back, making them a desirable alternative to student loans. Scholarships may be used to pay for education-related costs including tuition, books, and other course materials. Some scholarships may also be used to cover food, room-and-board, laundry, and day-to-day expenses.

Thousands of different scholarships are available. Merit-based scholarships are typically given to students with high GPAs or an extensive record of community service. Other scholarships may be allotted to certain groups of people, including women or minority students. There are also scholarship options for students who demonstrate financial need.

In order to qualify for most scholarships, students must first complete an application. While the nature of these applications will vary by award, most will include the following general criteria:

  • Grades/Transcripts: Most scholarships (merit- and non-merit-based) require a minimum GPA for consideration; this minimum is usually 2.5 or higher. Additionally, some impose minimum scores on the SAT, ACT, or other college admissions tests.
  • Essay: Many scholarships require applicants to complete an original written testimonial explaining why they deserve the award.
  • Letters of Recommendation: A scholarship application may ask for letters of recommendation from teachers, school counselors, former employers, and other people who have interacted with the student in an educational or professional environment. These letters should not come from friends, relatives, or family acquaintances.
  • College Information: Many scholarships will only award money to applicants who have enrolled or plan to enroll in an accredited postsecondary institution within the following year. Some are only allotted to students who plan to pursue certain fields of study.
  • Other Financial Aid: For needs-based scholarships, applicants may need to prove they are not receiving federal financial aid, additional scholarships, grants, or other forms of monetary support.

HERE ARE A FEW EXPERT PIECES OF ADVICE FOR FILLING OUT SCHOLARSHIP FORMS:

  • Begin your scholarship search during your freshman year of high school and compile an organized, comprehensive list of options before your senior year. Earning scholarship funding is essentially a numbers game; the more scholarships you apply to, the more financial support you’re likely to receive.
  • Apply to every scholarship award for which you are eligible. Smaller scholarships are generally less competitive, and these awards can increase your overall support.
  • Fill out all applications in pencil and be sure to proofread each section for misspelled words, grammatical errors, and awkward phrasing.
  • Essays should be personal and heartfelt. Applicants should take this opportunity to demonstrate their writing skills and speak directly to the scholarship committee; be as expressive and direct as possible.
  • If an online option is unavailable, submit your application to the scholarship committee by direct mail. In either case, be sure to keep a copy for your records in case the original application is not received.
  • Be mindful of deadlines and make sure every application has been finished and submitted before its due date.

EXTERNAL SCHOLARSHIP RESOURCES

Students who are unfamiliar with scholarship applications should seek advice from educational experts. Here are a few online resources for scholarship applicants to peruse:

QuestBridge: This organization provides assistance and support to low-income and underprivileged men and women with college aspirations. QuestBridge’s website features links to more than a dozen scholarship databases.

FastWeb!: This comprehensive financial aid database allows users to customize scholarship criteria in order to generate a list of applicable awards.

ScholarshipAmerica.com: This organization “works to engage private sector support for programs and policies that advance equity in postsecondary education.” Their site links to 15 government-sponsored and private financial aid databases.

CareerInfo.net: The scholarship aggregator on this U.S. government-sponsored site lets users customize scholarship options by award type, education level, state of residence, and award sponsor.

BigFuture: CollegeBoard’s customizable scholarship aggregator allows users to browse more than 2,200 scholarships, internships, and other financial aid opportunities.

Some of the most common scholarships include:

Colleges and Universities: Most postsecondary institutions offer scholarships to current and prospective undergraduate and graduate students. Many scholarships are specific to major fields of study or offered exclusively to students in certain gender or minority groups.

Foundations: Students should explore scholarship opportunities through established businesses and professional organizations affiliated with their proposed field of study. Other foundational awards are available through women’s or minority rights advocacy groups.

Local Community Organizations: Scholarships are often offered through community-based groups such as churches, youth centers, rotary clubs, and chambers of commerce. While these awards tend to be smaller in monetary value, they are also typically less competitive than national or statewide scholarships.

2017 Best Cities for Summer Internships

Standard
Landing an internship is one of the best ways to get a head start on your career. In fact, a recent study from iCIMS showed that 70% of employers and recruiters say an internship is more important than a high GPA on a new grad’s resume.

But some places are definitely better than others when it comes to finding an internship. Students might find cities with more access to public transportation useful. And it’s hard to justify moving for an unpaid or low-pay internship to a city where rent is astronomical.

Those are just two of the metrics GoodCall analysts used to rank the 2017 Best Cities for Summer Internships. These are cities that have a high number of available internships per capita, where cost of living is reasonable and crime isn’t rampant. They’re also generally nice places to live, with abundant restaurants, bars and other amenities.

The top 10 Best Cities for Summer Internships were:

  1. Morgantown, W.V.
  2. Greenville, S.C.
  3. West Des Moines, Iowa
  4. Naples, Fla.
  5. Neenah, Wisc.
  6. Charlottesville, Va.
  7. Asheville, N.C.
  8. Golden Valley, Minn.
  9. Salt Lake City, Utah
  10. Portsmouth, N.H.

Morgantown, a city of just over 30,000, had the 12th highest internships per capita, eighth most restaurants per capita, a skilled workforce, and median rent for less than $600. The city in northeastern West Virginia is a college town – home to West Virginia University – and it sits on the eastern side of the Monongahela River.

The cities in the top 10% of the list were spread across the country, but many of the lowest ranked cities were in California and Texas. Top cities also tended to be a bit smaller: The top 10% average about 89,000 residents, while the bottom 10% averages over 103,000.

View the full list.

Methodology

Analysts ranked 1,122 cities based on 11 metrics to indicate areas that are great for students. Here’s breakdown of the score:

Potential for Students to Get a High-Quality Internship

25% – Number of Available Internships per 10,000 people. Data came from Indeed. using Indeed’s “internship” filter.

10% – Networking Potential. Data represents the number of firms per 1,000 people from the Economic Census 2012 Geographic Area Series. In cities where data wasn’t available, county-level data was used instead.

10% – Skilled Workforce. The percentage of the civilian employed workforce age 16 and older in management, business, science, and arts occupations from American Community Survey 2015 1-year supplemental estimates.

5% – Unemployment. Data came from the American Community Survey 2015 1-year supplemental estimates for residents age 16 and older.

Affordability

10% – Cost of Living. Costs include housing, groceries, health care, and other metrics, from Sperling’s best places 2016 data by city.

10% – Rent. The median gross rent from one-bedroom renter-occupied housing units paying rent from the ACS 2015 5-year estimates.

10% – Commute Time. Data shows the percentage of workers who do not work at home whose commute is less than 30 minutes, from the American Community Survey 1-year supplemental estimates.

5% – Public Transportation. The percentage of workers age 16 and older who commute to work using public transportation, from the 2015 American Community Survey 1-year supplemental estimates.

Nice Place for Students

5% – Restaurants and Bars. Metric shows the number of food and drinking places per 1,000 people, from the Economic Census 2012 Geographic Area Series by economic place. In places where city data wasn’t available, county-level data was used.

5% – Amenities. The number of arts, entertainment, and recreation facilities per 1,000 people, from the Economic Census 2012 Geographic Area Series by economic place. If city data wasn’t available, county-level data was used.

5% – Crime. The number of crimes per 1,000 residents, from the FBI 2015 data for cities.

Mom helps her quadriplegic son pursue his MBA and receives a surprise at his graduation

Standard
Mom helps her quadriplegic son pursue his MBA and receives a surprise at his graduation

A California mom who helped her quadriplegic son pursue his Master of Business Administration degree received a surprise at his graduation ceremony last weekend — an honorary degree of her own. (Image source: KTLA-TV screenshot)

A California mom who helped her quadriplegic son pursue his Master of Business Administration degree received a surprise at his graduation ceremony last weekend — an honorary degree of her own.

According to ABC News, Marty O’Connor, 29, was paralyzed in 2012 after falling down a flight of stairs. After spending almost two years working on his physical recovery, he wanted to pursue a new challenge.

“After a certain point I realized that physical therapy wasn’t going to be the end all answer,” O’Connor told ABC News. “I was ready to take on another mental challenge.”

Before his accident, O’Connor worked in sales. So he decided to enroll at Chapman University, in Orange, California, for his master’s degree. But due to his injury, Marty O’Connor was unable to take notes or even raise his hand in class. So his mom, Judy O’Connor, a retired elementary school teacher, stepped in to help him.

She attended all of her son’s classes with him, took notes for him, and raised her hand when he had a question in class during his entire two-year MBA program.

“I did it willingly,” Judy O’Connor told ABC. “When a spinal cord injury happens, you want to swoop in and make everything better and you can’t.”

“This was something that I could do for my son and I was really happy that I was able to help him in that way,” she said.

Judy O’Connor said her son underwent a “total transformation” during his time at Chapman and he excelled at his studies.

Earlier this year, when Marty O’Connor was granted the university’s outstanding graduate student award, he asked Chapman University President Daniele Struppa for a favor — to surprise his hardworking mother with an honorary degree at his graduation.

View image on Twitter

Back to school, and back to work http://chapma.nu/2qt9cjb  Marty O’Connor resets career with   after accident


 “When Marty came to me asking if Chapman could present an honorary degree to his mom – and to keep it a surprise – there was no hesitation to make this happen,” Struppa told ABC News. “The provost, the dean and the faculty Senate immediately approved my request. The dedication from both Marty and his mother in his pursuit for a Master’s in Business Administration is nothing short of admirable. We were more than happy to make this happen.”

At the graduation ceremony last weekend, Judy O’Connor received the degree — and a standing ovation.

“I was so touched that my son would do that,” she said. “It was therapeutic for me to do what I did.”

According to ABC News, Marty O’Connor will soon begin a job as the head of corporate sponsorships for DIVERTcity, a youth sports startup.

‘It was tough, but we did it’: Mom and daughter graduate college together

Standard

This Mother’s Day, an East Texas mom is celebrating a major accomplishment, one she achieved alongside her daughter.

Amy Weakley completed her bachelor’s in business administration from the University of Texas at Tyler this semester.

As Amy walked the stage on May 6, daughter Madison was right behind her mom.

“Not only am I excited for myself to graduate, but I’m really proud of my mom for also being able to,” said Madison.

The path to graduation was not an easy one for mom or daughter.

“She could’ve given up but she didn’t,” Madison said of her mom. “She kept powering through, and that’s what she does with everything.”

“A lot classes I took at night,” Amy explained. “Then you come home and do homework and you’re up late.”

While her daughter finished college in four years, Amy took several classes a semester for eight years while also working full-time for the UT Tyler School of Business and Technology.

“If you know Amy, sometimes you know things are tough, but not because Amy told you,” Dr. Barbara Wooldridge said of the colleague who would later become her student.

“I realized how bright she was so I started nagging,” said Wooldridge. “‘When are you going to apply to school? When are you going to apply to school?'”

Amy said that type of support from family and friends helped get her back into the classroom after 15 years away.

“It’s the fear of ‘I’m going to be the old person in the classroom, and am I going to remember how to do A+B=C?'” she said. “But you figure it out.”

Those around Amy say her persistence extends far beyond the classroom.

She gave birth to Madison six months after graduating high school. In the years to come, Jamie Nelson saw firsthand the struggles that came her friend’s way.

“Just some of the typical challenges of single motherhood,” said Nelson. “Waiting for paychecks the stress of just raising a child, and she never let that get her down. [She was] always focused on providing the best life for Madison and always being positive.”

In 2004, Amy got married. She said Clint was not only her husband, but also a dad to Madison.

Within months of their wedding, doctors diagnosed Clint with bipolar disorder, which he battled for the next 11 years.

“My step dad passed away. He committed suicide two years ago,” a tearful Madison explained. “It was right before finals week. It was hard on me, and I cant imagine how hard it was on Mom.”

Despite their devastation, Amy and Madison chose to finish their classes and take finals.

“I know we both just finished strong that semester,” said Madison. “He’d be proud of Mom for sure and I think he’d be really proud of me too.”

“I think no matter what you’re going through, you can always push through and meet your goals,” Amy said. “It just takes dedication and determination.”

Two qualities that were instilled in Amy by her own mom.

“Everyday you wake up and have a smile on your face and that’s that,” Amy said. “It’s a choice. It’s what I did. It’s what I do everyday.”

Graduation day was no exception.

“I’m really proud of her for sticking with it and accomplishing something she never thought she would,” said Madison.

Madison will begin pursuing her master’s in accounting this fall. Her mom will start graduate school at the same time to pursue her master’s in business administration.

UC Board of Regents approves policy on nonresident student enrollment

Standard

The University of California Board of Regents today (May 18) approved a policy on nonresident undergraduate enrollment that reaffirms UC’s historic commitment to California residents by limiting the proportion of out-of-state and international students at its nine undergraduate campuses.

Under the policy, the first of its kind at UC, nonresident enrollment will be capped at 18 percent at five UC campuses. At the other four campuses where the proportion of nonresidents exceeds 18 percent — UC Berkeley, UC Irvine, UCLA and UC San Diego — nonresident enrollment will be capped at the proportion that each campus enrolls in the 2017–18 academic year.

“Our new nonresident enrollment policy strikes the right balance between UC’s continued commitment to putting California students first and the significant benefits that out-of-state and international students provide the university,” said UC President Janet Napolitano. “This policy represents a broad consensus achieved after extensive consultation with regents, legislators and other stakeholders.”

The state’s Budget Act of 2016 called for the UC Board of Regents to adopt a policy limiting the number of undergraduate nonresidents as a condition for receiving $18.5 million to support the enrollment of an additional 2,500 California resident undergraduates in the upcoming academic year.

UC is not only on track to enroll an additional 2,500 Californians this fall, but through an agreement with the state, it enrolled more than 7,400 additional California residents in fall 2016, the largest year-to-year jump in California resident enrollment since the end of World War II.

UC’s strong focus on serving in-state undergraduates is unique among many top-ranked public institutions. UC nonresident undergraduate students currently make up about 16.5 percent of total undergraduates systemwide, compared with an average of 27.9 percent for the public institutions in the Association of American Universities (AAU). In fact, all UC campuses enroll less than one-quarter of their undergraduates from outside California — well below the average proportion of nonresident enrollment for public AAU institutions.

“True to the university’s mission, our nonresident enrollment policy underscores our unwavering commitment to the students of the state under the California Master Plan for Higher Education by offering a place on at least one of our campuses to every California applicant who meets UC’s requirements for admission,” Napolitano said. “It also reaffirms our pledge that nonresident students will be enrolled only in addition to, and never in place of, Californians.”

The newly adopted policy also calls for the UC Board of Regents to review the nonresident policy in at least four years. Periodic review of the policy will allow the regents to assess its efficacy in maintaining and enhancing the educational experience and access of California students.

University of California Admission by exam

Standard

If you don’t meet UC’s minimum requirements, you may be considered for admission to UC if you earn high scores on the ACT with Writing or SAT and two SAT Subject Tests.

In general, this method of consideration is designed for students who have been unable to meet the regular subject requirements and/or earn a high school diploma because of unique circumstances, such as non-traditional education or long-term illness.

To be considered, you must take either the ACT with Writing or the SAT, as well as two SAT Subject Tests.

You must earn a minimum UC Score total — calculated according to the instructions below — of 410 (425 for nonresidents). In addition, you must achieve a minimum UC score of 63 on each component of the exams.

You may not use a SAT Subject Test to meet these requirements if they have completed a transferable college course with a grade of C or better in that subject.

How to convert your test scores to UC Scores:

If you took the SAT Reasoning Test (prior to March 2016):

  • Convert the highest scores in critical reading, math and writing from a single sitting and the two highest SAT Subject Tests from different subject areas to equivalent UC Scores (see the SAT test score translation table).
  • Add all five UC Scores to produce your UC Score total. For example: critical reading + math + writing + Subject Test 1 + Subject Test 2 = UC Score total.

If you took the SAT with Essay exam (starting March 2016)

  • Using scores from a single sitting, convert the new reading, math, and writing & language scores to the old SAT scores using the tables listed below. Get the equivalent UC Scores for the three converted scores using the SAT test score translation table.
  • Convert the two highest SAT Subject Tests from different subject areas to equivalent UC Scores using the SAT test score translation table.
  • Add all five UC Scores to produce your UC Score total.

SAT w/ Essay
Reading

Old SAT
Critical Reading

40 800
39 760
38 720
37 700
36 680
35 660
34 640
33 610
32 590
31 570
30 550
29 530
28 520
27 500
26 480
25 460
24 440
23 420
22 400
21 380
20 370
19 340
18 310
17 280
16 270
15 260
14 250
13 240
12 220
11 210
10 200

SAT w/ Essay
Math

Old SAT
Math

800 800
790 780
780 760
770 750
760 740
750 720
740 710
730 700
720 690
710 680
700 670
690 660
680 650
670 650
660 640
650 630
640 620
630 610
620 600
610 590
600 580
590 570
580 560
570 550
560 530
550 520
540 510
530 500
520 490
510 470
500 460
490 450
480 440
470 430
460 420
450 410
440 400
430 390
420 380
410 370
400 360
390 350
380 340
370 330
360 310
350 300
340 290
330 280
320 280
310 270
300 260
290 260
280 250
270 240
260 240
250 230
240 220
230 220
220 210
210 200
200 200

SAT w/ Essay
Writing & Language

Old SAT Writing

40 800
39 760
38 740
37 710
36 680
35 650
34 630
33 600
32 570
31 550
30 530
29 510
28 490
27 470
26 450
25 430
24 420
23 400
22 380
21 370
20 350
19 340
18 320
17 300
16 280
15 270
14 260
13 240
12 230
11 220
10 200


SAT test score translation

SAT Score

UC Score

SAT Score

UC Score

800 100 490 48
790 98 480 47
780 97 470 45
770 95 460 43
760 93 450 42
750 92 440 40
740 90 430 38
730 88 420 37
720 87 410 35
710 85 400 33
700 83 390 32
690 82 380 30
680 80 370 28
670 78 360 27
660 77 350 25
650 75 340 23
640 73 330 22
630 72 320 20
620 70 310 18
610 68 300 17
600 67 290 15
590 65 280 13
580 63 270 12
570 62 260 10
560 60 250 8
550 58 240 7
540 57 230 5
530 55 220 3
520 53 210 2
510 52 200 0
500 50

If you took the ACT Plus Writing:

  • Convert the highest math, reading, science and combined English/writing or ELA score from a single sitting to equivalent UC Scores (see the translation table below).
  • Multiply the sum of the converted math, reading and science scores by two-thirds, then add the converted English/writing or ELA score.
  • Add this subtotal to your two highest SAT Subject Test scores from two different subject areas, which are also converted to equivalent UC Scores. For example: (math + reading + science) x 0.667 + English/writing + Subject Test 1 + Subject Test 2) = UC Score total.
ACT test score translation

ACT Score

UC Score

ACT Score

UC Score

36 100 20 47
35 97 19 43
34 93 18 40
33 90 17 37
32 87 16 33
31 83 15 30
30 80 14 27
29 77 13 23
28 73 12 20
27 70 11 17
26 67 10 13
25 63 9 10
24 60 8 7
23 57 7 3
22 53 1-6 0
21 50

University of California Admissions: SAT Subject Tests

Standard

While SAT Subject Tests are not required, some campuses recommend that freshman applicants interested in competitive majors take the tests to demonstrate subject proficiency.

Recommendations for fall 2017 applicants

Remember, these are recommendations, not mandates. You will not be penalized for failing to take the SAT Subject Tests. On the other hand, submission of these test scores (just like submission of AP and/or IB scores) may add positively to the review of your application.

Berkeley

College of Chemistry and College of Engineering: Math Level 2 and a science test (Biology E/M, Chemistry, or Physics) closely related to the applicant’s intended major.

Davis

Not recommended for any area.

Irvine

Claire Trevor School of the Arts: recommends that freshman applicants take any SAT Subject Tests that will demonstrate the student’s strengths.

Henry Samueli School of Engineering (including the joint Computer Science and Engineering major): Math Level 2 and a science test (Biology E/M, Chemistry, or Physics) closely related to the applicant’s intended major.

Department of Pharmaceutical Sciences: Biology M, Chemistry, and/or Math Level 2.

School of Physical Sciences: Math Level 2.

Program in Public Health Sciences: Biology E, Biology M, and/or Chemistry.

Program in Public Health Policy: Biology E, Biology M, and/or World History.

Los Angeles

Henry Samueli School of Engineering and Applied Science: Math Level 2 and a science test (Biology E/M, Chemistry, or Physics) closely related to the applicant’s intended major.

Merced

No recommendation at this time.

Riverside

College of Natural and Agricultural Sciences and Bourns College of Engineering: Math 2 and Chemistry or Physics, for all majors

San Diego

Jacobs School of Engineering and biological or physical sciences majors: Math Level 2 and a science test (Biology E/M, Chemistry, or Physics) closely related to the applicant’s intended major.

Santa Barbara

College of Engineering: Math Level 2

College of Creative Studies:

  • Math Level 2 for math majors
  • Math Level 2 and Physics for physics majors
  • Biology for biology majors
  • Chemistry for biochemistry and chemistry majors
  • Math Level 2 for computing majors

Santa Cruz

Not recommended for any area.


Submission deadline

Freshman applicants for fall 2017 must arrange to have official score reports sent to us by December 2016. If you plan to take an exam December, indicate the planned test date on your admission application.

And don’t worry — if you report your scores to one campus, they will be shared with every campus to which you’ve applied.

Australia Is Attracting More International MBAs After Careers In Entrepreneurship

Standard

We spoke to three Sydney-based international MBA students to find out why

Written by Marco De Novellis | MBA Australia | Monday 22nd May 2017 09:13:00 GMT

Shikha Kanojia relocated from Dubai to pursue an MBA at AGSM

Shikha Kanojia relocated from Dubai to pursue an MBA at AGSM

International students are snubbing traditional MBA destinations in the US and Europe for full-time MBA programs in Australia. Why? To differentiate themselves and stand out in a competitive MBA jobs market.

At Sydney’s top-ranked Australian Graduate School of Management (AGSM), 17 nationalities are represented in the current MBA class. The school boasts a 10,000-strong alumni network spread out across 68 countries worldwide.

85% of AGSM MBA students land jobs within three months of graduation. And many international MBAs see Sydney’s startup scene as the perfect place to take the leap into entrepreneurship and start their own business.

Shikha Kanojia, MBA ‘18

Shikha spent five years working at Deloitte in Dubai before moving to Australia for her MBA. After graduation, she aims to take the MBA triple jump – changing role, industry, and location – into a management consulting career in Sydney. She’s especially excited for the AGSM MBA’s entrepreneurship and innovation course. In the long-term, she hopes to start her own business.

Why did you decide to pursue an MBA at AGSM?

When I started to look for places where I’d like to pursue an MBA, I really resonated with Sydney. The big-city cosmopolitan vibe, strong economic fundamentals and an enviable lifestyle, all aligned well with my professional and personal goals.

AGSM was the only school I applied to in Sydney. Its collaborative community, integrated approach to learning, and partnerships with other elite global business schools made it a great fit for me. The program also has a strong focus on self-awareness and leadership development from the very start which helps make the experience transformative.

What stands out from your MBA experience so far?

We’re a bunch of 68 students in the cohort from over 20 different countries and with levels of work experience ranging from three to 10 years across a variety of industries and functions. It’s extremely rewarding to be sharing the MBA experience with such a diverse cohort. AGSM is a tight-knit community and the small class size means that you really get to know and learn from each other.

I also recently connected with alumni as part of AGSM’s 40th year grassroots fundraising initiative, and you really get a sense of how committed everyone is to engaging with and giving back to the community!

What are your plans for the future?

I intend to take an ambitious leap by changing role, industry and location – all at once! The AGSM MBA places you in good standing to achieve this. The diverse faculty, students and the larger community help shape your skills and perspective and make you more agile in the workplace. And the school’s careers team guides you through shaping your story, finding the right networks and navigating through the recruitment process.

Slobodan Gluvić, MBA ‘17

asasa

Prior to his MBA, Slobodan worked in finance for an Australian firm in his native Serbia. He joined AGSM’s full-time MBA program on a full scholarship. He graduated in April. Now, he’s looking to establish a career within Australia, and is considering starting his own business.

Why did you decide to pursue an MBA at AGSM?

My previous work experience was related to the Australian market. So, Australia stood out. The first school I applied to was AGSM and I was privileged to receive a Global Reach scholarship which made my studying in Australia possible.

Australian business schools are working towards challenging the status quo and getting to the top tiers of the MBA rankings. On top of this, Australia has decided to become more competitive worldwide in innovation. Business schools are appropriating funds to bring quality people over so, like I did, you can even get full funding for your MBA.

What stands out from your MBA experience so far?

Being from a small country and with non-existent exposure to corporations, I was oblivious of all the great ideas corporations around the world are rushing to develop and integrate in their systems. Now, I have learned how global businesses function.

I have met many excellent people and learned that, although I come from a background that is not as competitive as others, I can still add value to the classroom. The sense of friendly competition is pushing me to perform even better and the friendships I’ve made will last a lifetime.

What are your plans for the future?

In the long run, I want to start working on a startup idea which I believe has a lot of potential. Australia is currently one of the best places in the world for starting something new. The MBA has taught me how to be business-savvy and have a thought-out process in everything I do. I’ll always rely on the skills I’ve picked up during my MBA for my future endeavors.

Zach Pettinger, MBA ‘17

asa

After almost a decade working in finance for big corporates like KPMG, Zach relocated from the US to pursue an MBA in Australia. With a group of MBA colleagues, he co-founded his own gaming startup. He’s now considering whether to transition into entrepreneurship full-time.

Why did you decide to pursue an MBA at AGSM? 

I was actually in the process of applying to schools in the US when I took a vacation to Australia. I absolutely loved the country, especially Sydney, so I googled Australian MBA programs and naturally AGSM came up at the top.

After a bit of research, I realized that the AGSM program offered so much more than just the perfect location. It would give me the chance to work with incredibly smart and diverse international students at a top-tier university, which would help set me apart from other US MBA grads with similar backgrounds.

What stands out from your MBA experience so far?

The program has completely transformed me personally and professionally. AGSM’s high percentage of international students has given me a chance to work with people from many different cultures, vital learning for the global workplace.

Personally, I am more confident leading the discussion and gaining buy-in from the group than I was in the past. I am more willing to take risks to pursue my true passions. I know that I am walking away from the AGSM with amazing friends and an invaluable professional network

What are your plans for the future?

The key for me is finding a role that I’m passionate about. I want to work for a company that is changing the world and has a vision that I believe in.

The MBA has empowered me to try something different and has given me the business background to help me succeed, whether that is digging deeper into an accounting role or branching out into another area or industry that I find exciting.

California to Limit Foreign University Students

Standard

A new policy takes effect at the beginning of the 2017-2018 academic year and will limit enrollment of non-California residents to 18 percent of the student population at five University of California campuses: Santa Barbara, Davis, Santa Cruz, Riverside and Merced.

The other four campuses, in Los Angeles (UCLA), Berkeley, Irvine and San Diego, have more than 18 percent non-Californian students. They will be barred from further increasing the proportion of non-state residents in the new school year, which begins in late August on most campuses.

Qualified California students ‘losing out’

The state Board of Regents approved the new limits Thursday, following a release of an auditor’s report that said California high school graduates who otherwise were qualified for university admission have been losing out to non-state residents.

A tactic the universities adopted years ago — encouraging the enrollment of out-of-state residents, who pay higher fees than Californians, to circumvent state government funding cutbacks — “has made it more difficult for California residents to gain admission,” state auditor Elaine Howle said.

The issue was hotly debated before the Board of Regents voted to enact limits on foreign and out-of-state students.

Board of Regents member Hadi Makarechian came to California from Iran in the 1960s as an international student. He warned that the 18 percent limits will prompt talented international students to look elsewhere for college.

Overall, about 3,800 foreign undergrads

“I know the in thing today is to build walls, but we are building a wall around the University of California by doing this,” Makarechian said.

The California state university system, one of the largest in the United States, has about 210,000 undergraduates, about 16.5 percent of whom are non-Californians.

Less than 11 percent of the out-of-state undergraduates, about 3,800 individuals, are international students, coming to the U.S. from about 100 countries.

Some of the financial pressures that confront the Board of Regents emerged during this week’s meeting: California’s state-run colleges receive about $61,000 in tuition and other fees each year from non-state residents, while state residents pay about $27,000 less.

International students’ economic boost

International students who attend public or private colleges and universities in California add $5.2 billion to the state’s economy, according to official estimates. Nationwide, international students add $32.8 billion to the U.S. economy, according to the National Association of International Educators.

UCLA Chancellor Gene Block told the regents earlier this year that higher tuition from non-state residents helped the school avoid cuts in class offerings as state education spending dropped.

However, a state lawmaker, Assemblyman Kevin McCarty, said he and other legislators have been hearing from parents that their children were being denied admission to state universities in favor of out-of-state students with “lower academic scores.”

University of California President Janet Napolitano listens during a meeting of the Board of Regents, May 18, 2017, in San Francisco.

University of California President Janet Napolitano listens during a meeting of the Board of Regents, May 18, 2017, in San Francisco.


University of California President Janet Napolitano said the new limit on out-of-state residents is balanced and supports “our pledge that non-resident students will be enrolled only in addition to, and never in place of, Californians.”

Napolitano, who served as Secretary of Homeland Security under former President Barack Obama, said the state university system still provides opportunities for students from around the world.

Stiff competition among applicants

Competition for admission at California universities is intense.

UCLA received 102,000 applications for the freshman class whose classes begin August 21. It was the first time that more than 100,000 students applied. Last year, UCLA accepted about 17,500 freshmen, including about 40 percent non-Californians, or 4,600 Americans from other states and 2,500 foreign students.

Overall, the California system received 210,000 undergraduate applications for the 2017-2018 academic year, including 33,995 from out of state and 32,647 from international students, more than 31 percent of the total. Those numbers also reflect a 1.1 percent drop in the number of applications from foreign students.

International Graduates Winning Right to Work in U.S.

Standard

International Graduates Winning Right to Work in U.S. - Topadmit

Study shows approvals have gone up for “optional practical training” of up to three years. Students from China and India account for more than half of those winning the prized approvals.

Many international students who enroll at colleges in the United States long to get jobs in the U.S. after they graduate. And while there is no right to do so on the basis of student visas, a program that allows such employment — and whose future is unclear during the Trump administration — is growing.

The Pew Research Center on Thursday released data showing that the annual number of “optional practical training” approvals rose from 28,497 in 2008 to 136,617 in 2014. The OPT rights are a major incentive for students from some countries to enroll at American colleges. And some American experts on enrollment trends believe that uncertainty about OPT’s future could be discouraging some international students from enrolling.

In many ways, the OPT program is consistent with some of what President Trump has said about visas, which is that they should favor those who want to work in high-demand fields. The OPT program favors those who work in science and technology fields, as visas for them can last for three years after graduation. For others, the program only lasts one year. But as the Trump administration’s policies on immigration are fluid, many remain nervous about what could happen to the program.

STEM graduates are nearly half (49 percent) of those approved for OPT in the last three years. Since those in STEM can stay longer, the share of OPT visa holders in science and technology jobs continues to rise. By far, the top countries of origin for those winning OPT visas are India and China.

At the universities for which graduates have the most success at obtaining OPT, thousands have won them in recent years.

Top 10 Universities Whose Graduates Won OPT Visas, 2012-15

Rank University Number
1. University of Southern California 7,485
2. Columbia University 7,116
3. New York University 5,260
4. Carnegie Mellon University 4,485
5. City University of New York 4,329
6. University of Illinois 4,247
7. University of Michigan 4,216
8. Northeastern University 4,076
9. University of Texas at Dallas 4,039
10. University of Florida 3,742

By Scott Jaschik May 19, 2017